
Trend Analysis – Peak and Trough Analysis
Master Class: “Price Action” Trading Approach
The idea is not so new or radical to talk about a revolution in trading. Most technical indicators were created during the development of electronic trading. Most of them are 20-30 years old and all indicators are just a derivative from prices.
Let’s check what benefits to we get from indicators
1. Oversold and Overbought levels.
2. Divergence.
3. Filtration of false signals.
Indicators are making the process of persuasion of the market way easier, however the information given by them has a delay as the calculation of coefficients is based on prices and because of that the indicators cannot be ahead of prices and most of them, sometimes can change with the price change, giving false signals which are leading to lose.
Who remembers now what is a trend and how to indicate the current phase of the market? There is one simple but effective approach, regardless the IT progress. The old methods had been before and they work now. Unfortunately, not many people remember about them relaying on computers.
Peak and Trough Analysis. The technique, initially presented as an approach based on the Dow Theory still works, regardless that the theory probably lost a part of it’s shine. I think that this method is foundational for the Technical Analysis.
When we research any chart, it’s visible that the price isn’t stable, it’s always moving up and down. During a trend, the rally is replaced by correction where part of growth is lost. Then we see a new rally, then new correction etc.. This are the Peaks and Troughs.
While price is moving in a series of growing peaks and troughs, the trend is considered not damaged. As soon as growing peaks and troughs are being replaced by lowering peaks and troughs, it indicates the trend reversal.
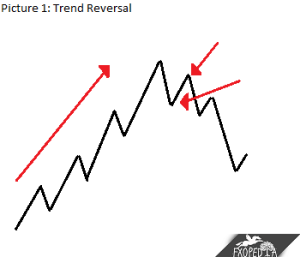 The “Picture 1” shows a sequence of peaks and troughs. When the price is unable to create a new maximum it may indicate that the trend may reverse. However it will not happen unless the price falls lower the previous minimum (pic. 2) and unless we see lowering peak and trough. According to this approach, the trend will be replaced by Bearish.
During the Bearish trend the prices are continuing the lowering rotation of peaks and troughs (pic. 2), unless the last price on the last trough is able to update the next minimum (pic. 3). 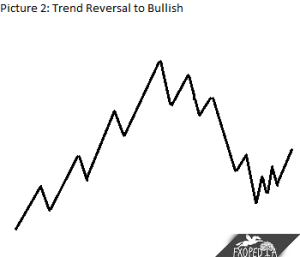 Subsequent movement leads the price above the previous maximum (pic. 4) and the rotation of peaks and troughs is being replaced by growing. Actually, the signal will appear in the point (pic. 5) when it becomes obvious that the price created a new maximum. We don’t now when will appear the next peak, at that point, but we are sure that it will be above the previous peak and through.
As it appears on the 6th point of the “Chart 5”, nothing disturbs the price to fall below the signal of the trend reversal, however the chart will still be evaluated as a Bullish trend.
Semi Signals
There are situations when we doubt if there was a trend reversal or not. “Picture 3” shows that on the point 1 the last trough failed below the previous one, however this doesn’t apply to the last peak, because of that we have a semi signal.
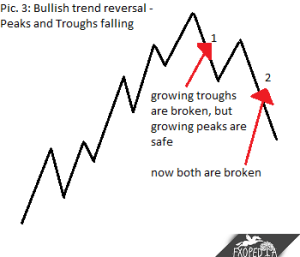 What’s next? It’s needed that the price new movement to reach a maximum below the previous peak and after that the price needs to fall below previous minimum in the point 2. This is the semi signal i.e. less reliable as the price, probably, will go far from the last maximum, however the possibility of validity of the reversal is higher. If we will not wait for the signal in the point Y, we may get to a strong rally as is shown in picture 4.
In this case the prices increased and created a new peak, identifying that the trend hasn’t been reversed (how to deal with this will be explored in next articles). The semi signals may appear during reversal from a Bearish to Bullish trend.
The semi signals are not as reliable as fully relevant to the theory situations, however in the next articles we will discuss how we can use the signals for profitable trading.
Peak and Through Analysis should be considered in conjunction with other techniques of technical arsenal. 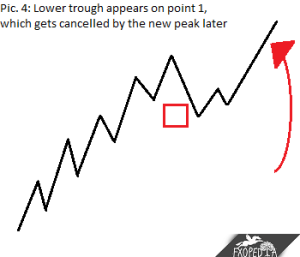 The difference of the Peak an Trough Analysis, as an indicator, is in presupposition of a stronger signal instead of delaying computer algorithms.
Consolidations
Sometimes, the kickbacks within trend are being developed in a form of trading range. We can see some bullish movement after growth on the picture 4. The blowout from the trading range can be considered as a signal to open a position or as a confirmation of predominance of the trend. Actually, when prices blowout from a trading range, they violate some minor reversal points, which actually are Support and Resistance levels. In cumulation they represent more substantial peaks and troughs.
The value of Peaks and Troughs
The value of reversal on acting peak or trough always depends on the trend type under review. Longer the trend more valuable the reversal.
An example of the approach
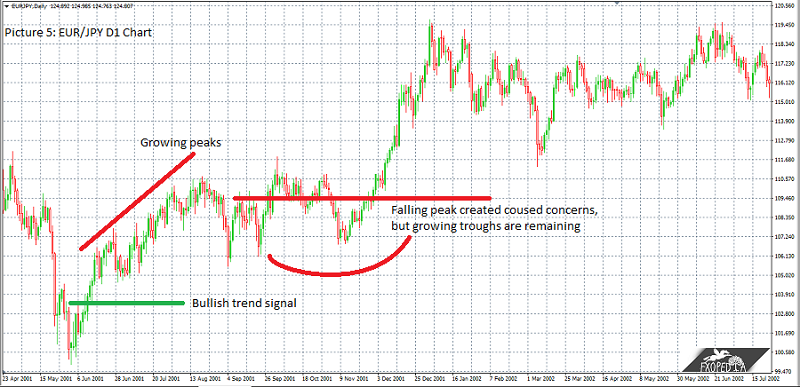
The Bullish trend signal appeared on the end of June 2001, the minimum was under the trough from the end of May. It was confirmed on the 11th of June, when the price broke the maximum of the 6th of June. Some concerns regarding the direction of the trend appeared on the middle of September and the end of October. As the maximum appeared lower the previous one. However there were no signs of lower troughs. Because of that it’s better not to trust the semi signals.
Any questions? Please ask in the Forex Traders Forum
Hello
YOU NEED QUALITY VISITORS FOR YOUR: fxopedia.com ?
We Provide Website Traffic 100% safe for your site, from Search Engines or Social Media Sites from any country you want.
With this traffic, you can boost ranking in SERP, SEO, profit from CPM
CLAIM YOUR 24 HOURS FREE TEST HERE=> http://damienkqva75185.bloggerbags.com/8099345/get-quality-visitors-for-your-site
Thanks, Stevie Metzler